PANDDA is available as a ready-to-use Docker box. Just download & run it and configure your own monitoring infrastructure! You can also use our Vagrant box
When the PANDDA box is up-and-running, you can access the Configurator tool from your browser on http://localhost:8080 (Warning: the box needs ports 8080 and 8081 on your machine to work) to configure and provision your monitoring infrastructure.
Flow network monitoring infrastructure plays a crucial role in modern network management by capturing, analyzing, and interpreting data traffic flow across networks. It provides critical insights into traffic patterns and helps detect security issues. Network monitoring is essential for ensuring that networks perform optimally and remain secure in enterprise environments, data centers, or service provider networks.
- Flow Exporters are responsible for capturing raw packet data from network devices such as routers and switches. They aggregate this data into flow records. Flow is defined as aggregated information about ongoing computer network communication. The basic flow record simply contains information about which IP ADDRESS is communicating, how many BYTES have been exchanged, how many PACKETS have been exchanged, and which PORTS and PROTOCOL were used. Nevertheless, flows can also be enriched for other information. The flow exporter included in PANDDA can export domain names, payloads, packet sequences, SMTP information, and many more.
- Flow Collectors receive and optionally forward the flow records to persistent storage—large database. The flow records are then also processed. PANDDA provides passive asset management analysis of the devices. The analysis can extract information about connected network devices, their advertised services, and their activity.
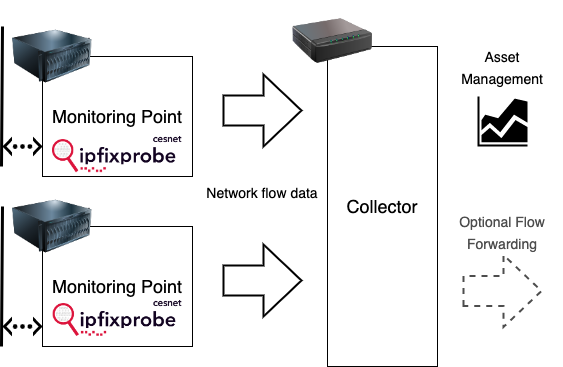
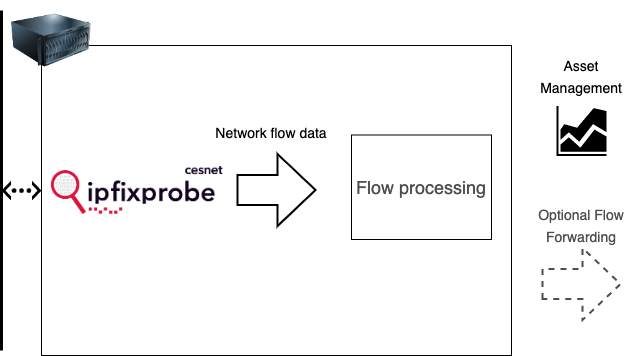
Depending on the size and structure of the network, different deployment strategies may be more suitable. This section outlines two common approaches: a distributed deployment with separate monitoring probes and a central collector, and a simplified all-in-one deployment where all components run on a single server. Each scenario offers distinct advantages and is tailored to different operational needs and resource constraints.
In this scenario, multiple monitoring probes are deployed across various network segments to capture traffic locally. Each probe is responsible for collecting flow data or relevant telemetry from its segment and forwarding it to a central collector. The collector aggregates, stores, and optionally analyzes the data.
The collector can be hosted on a dedicated standalone server to ensure scalability and separation of concerns, or it can be integrated into one of the probes to reduce hardware requirements in smaller-scale environments. This distributed architecture is well-suited for medium to large networks where visibility across multiple points is essential.
For smaller environments or edge use cases, a compact all-in-one deployment can be used. In this configuration, a single server hosts both the monitoring probe and the collector components. This setup reduces infrastructure complexity and is easier to manage and maintain. It is ideal for scenarios with limited traffic volumes or where centralized deployment is not feasible.
What do I need to monitor my network?
First and foremost, you'll need Pandda—though we're guessing you already have it. Ideally, you should also have a dedicated server with the following specifications described in the recommended HW page. PANDDA expects that the server is already installed with an Operating System. We recommend using Oracle Linux 9, but any EPEL 9 distribution should be compatible.