Our configurator can be used to quickly setup your monitoring infrastructure via a web GUI. It is available as a Docker box, please refer to the Get started page for installation.
You can find a step-by-step tutorial for the PANDDA web configurator with more detailed information.
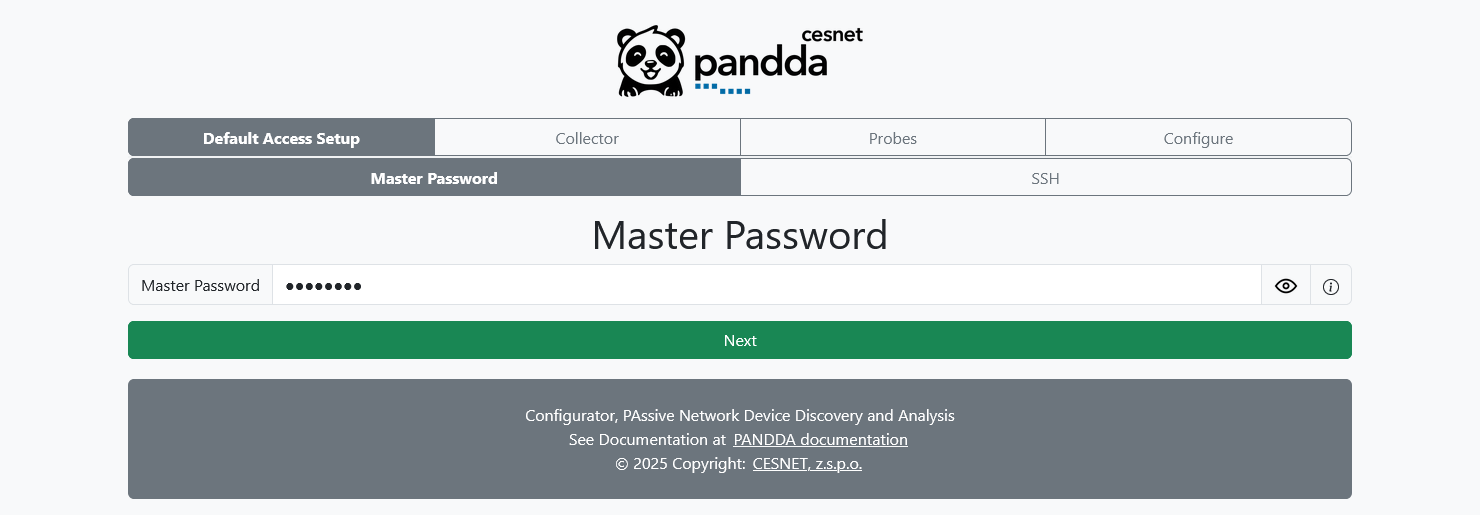
Master password is used to encrypt sensitive information (such as connection info) saved in the Docker machine to keep it save. Moreover, the last configuration is encrypted stored enabling you to return to it later. Be careful, the saved configuration is deleted when the entered master password is different than the one used for previous encryption.
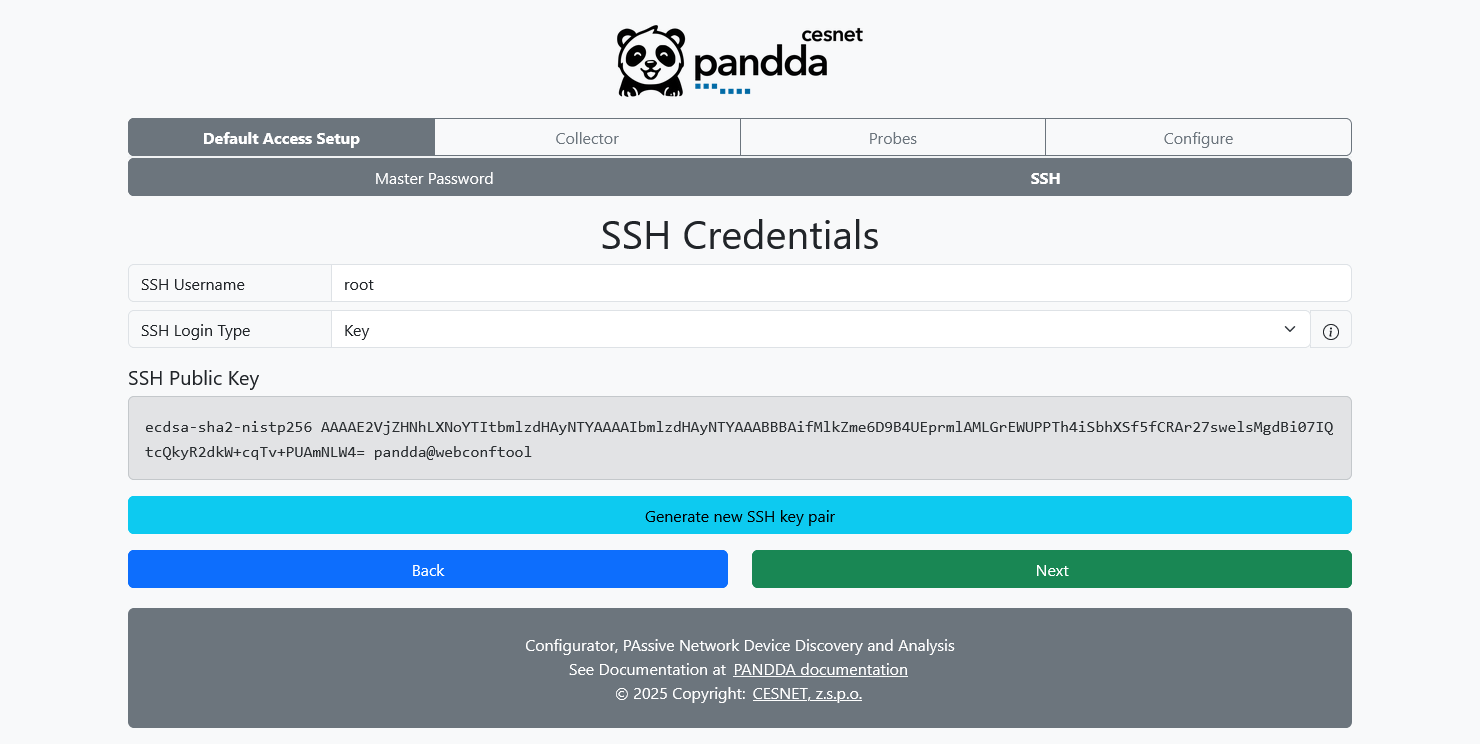
Here you can define global login credentials used for SSH login. It will be used by default to connect to all the machines which you will define later in the Configurator. However, you can override these credentials with per-machine settings on the corresponding pages.
When using the login type key, Configurator will provide you with public key, which you must install on the target machines yourself. If a key-pair already exists, Configurator will it. However, you can force generation of a new key-pair.
For more info about the SSH, please see SSH Academy.
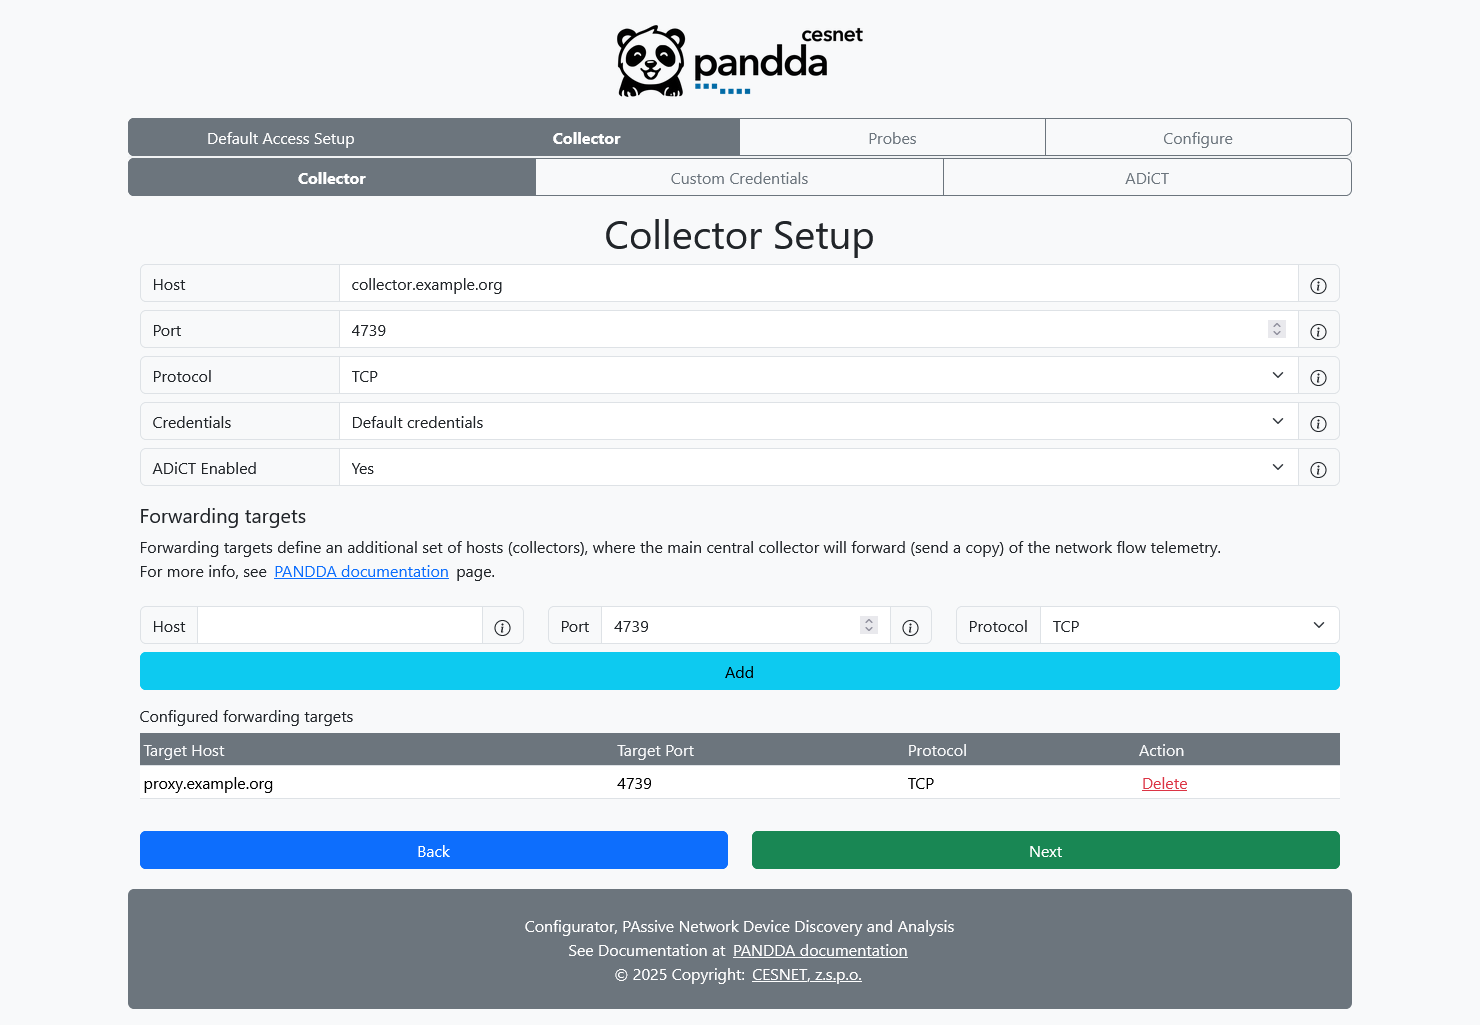
This page is used to configure the machine which will serve as a collector.
Port will be opened on the target machine and used to listen for incoming IPFIX messages from network monitoring probes.
If your collector server uses different login credentials then you provided on the Global SSH Login page, use Custom Credentials option to override them on the next page.
If you wish to forward received flow telemetry to some other machines, use Forwarding Targets section to define where the Collector server should send copies of the received telemetry.
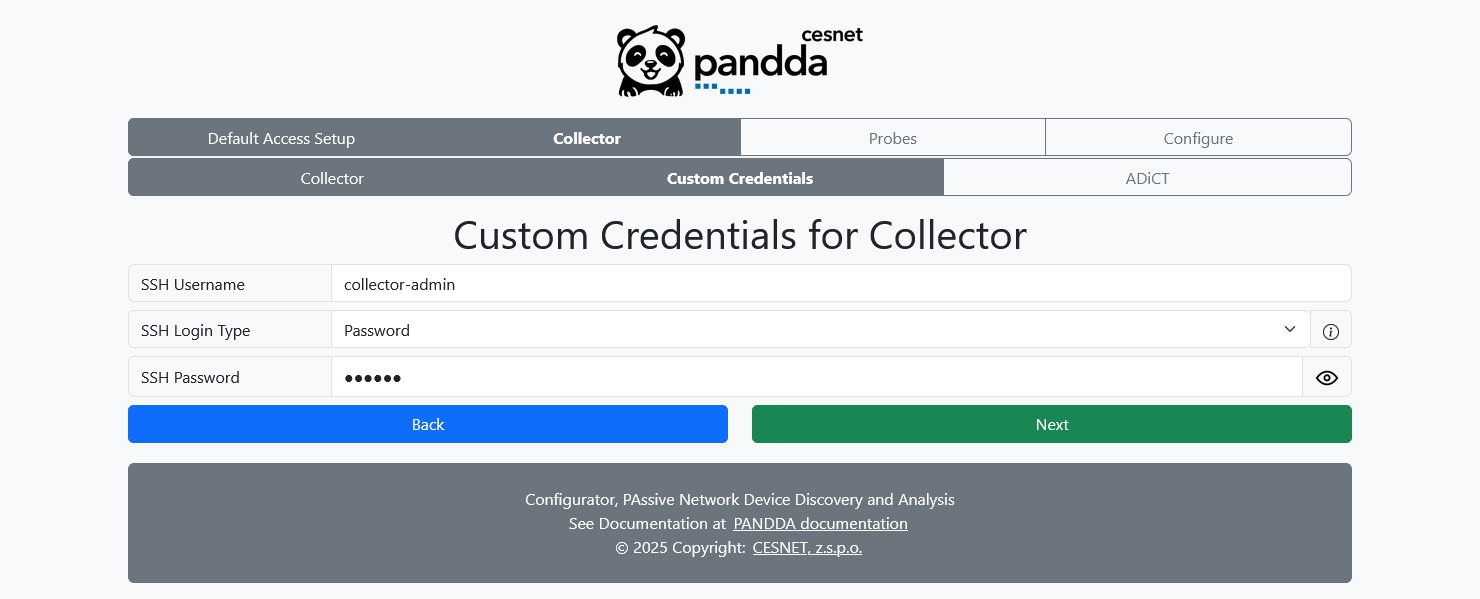
Custom Collector Credentials page allows you to override the credentials used to connect to the collector server.
Again, you can either provide a password or use the PANDDA-generated key-pair.
For more info about the SSH, please see SSH Academy.
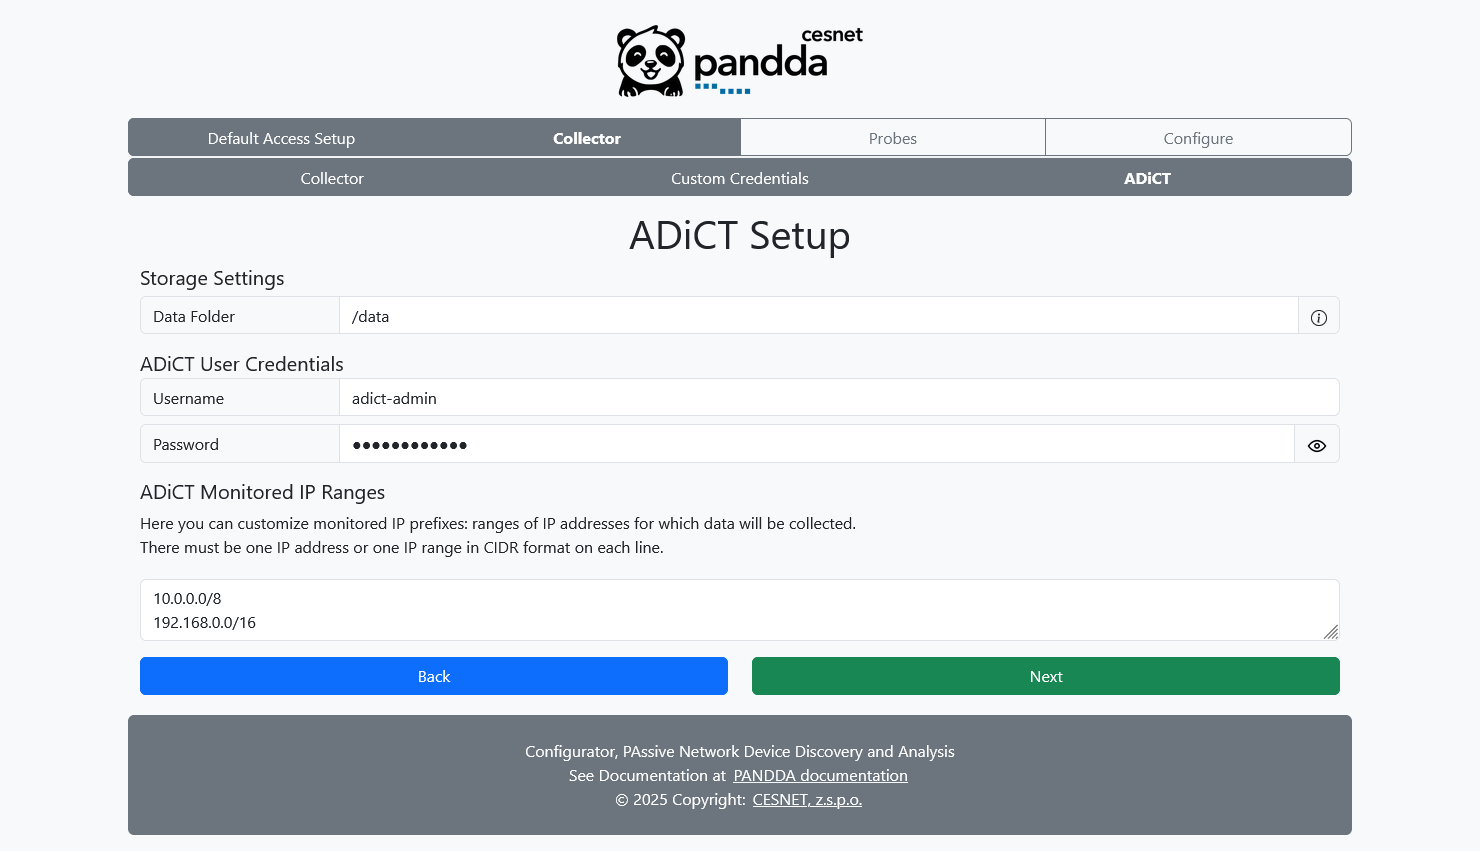
ADiCT page allows you to customize ADiCT, described here.
Data folder settings controls where ADiCT stores data. This allows you to choose which disk will be used.
Protected ranges define IP subnets (or ranges) that will be monitored and used by ADiCT. There must be one prefix in CIDR format per line.
Lastly, username and password for ADiCT GUI must be defined.
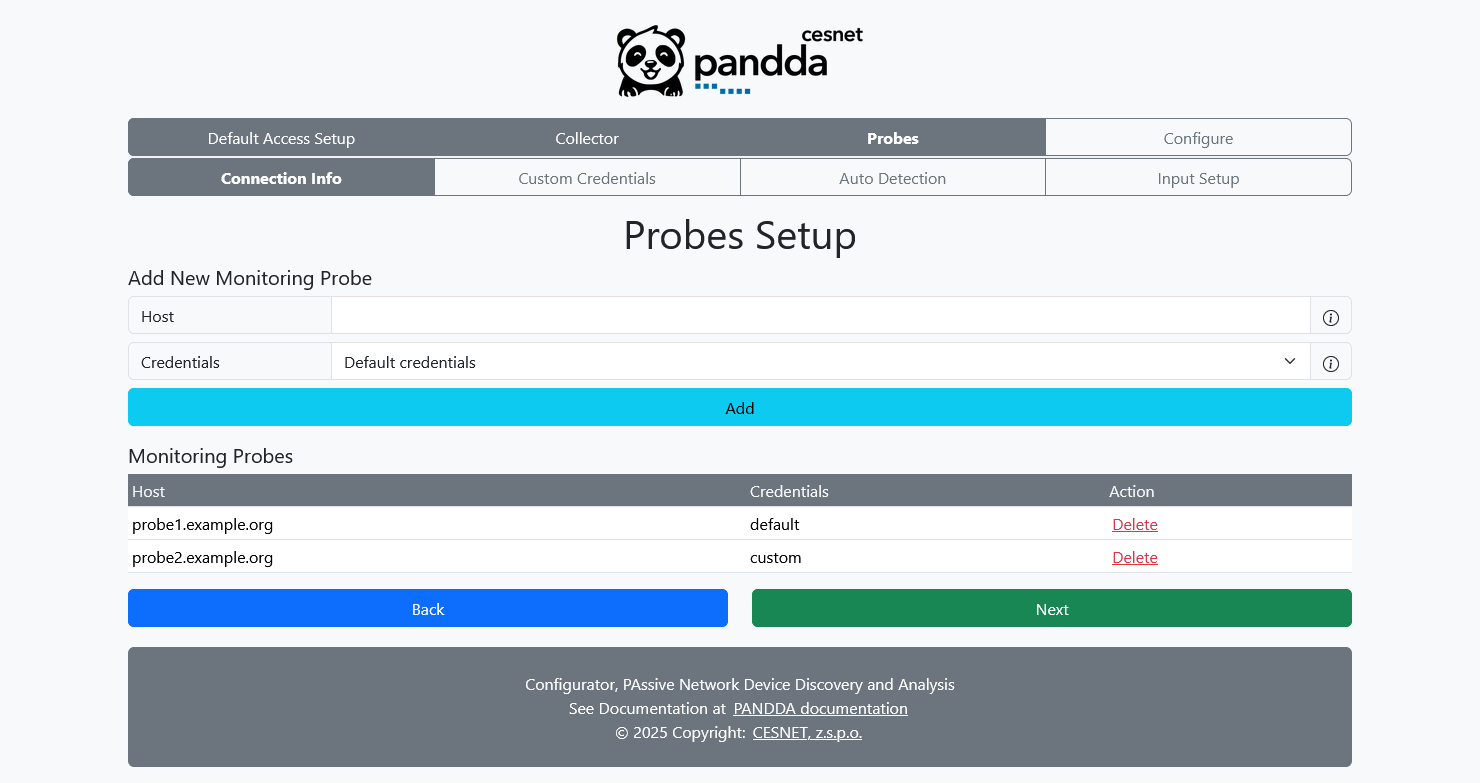
On this page, you define your network monitoring probes. You can specify 0-N probes, each uses the global credentials by default but you can again override them later by choosing Custom Credentials.
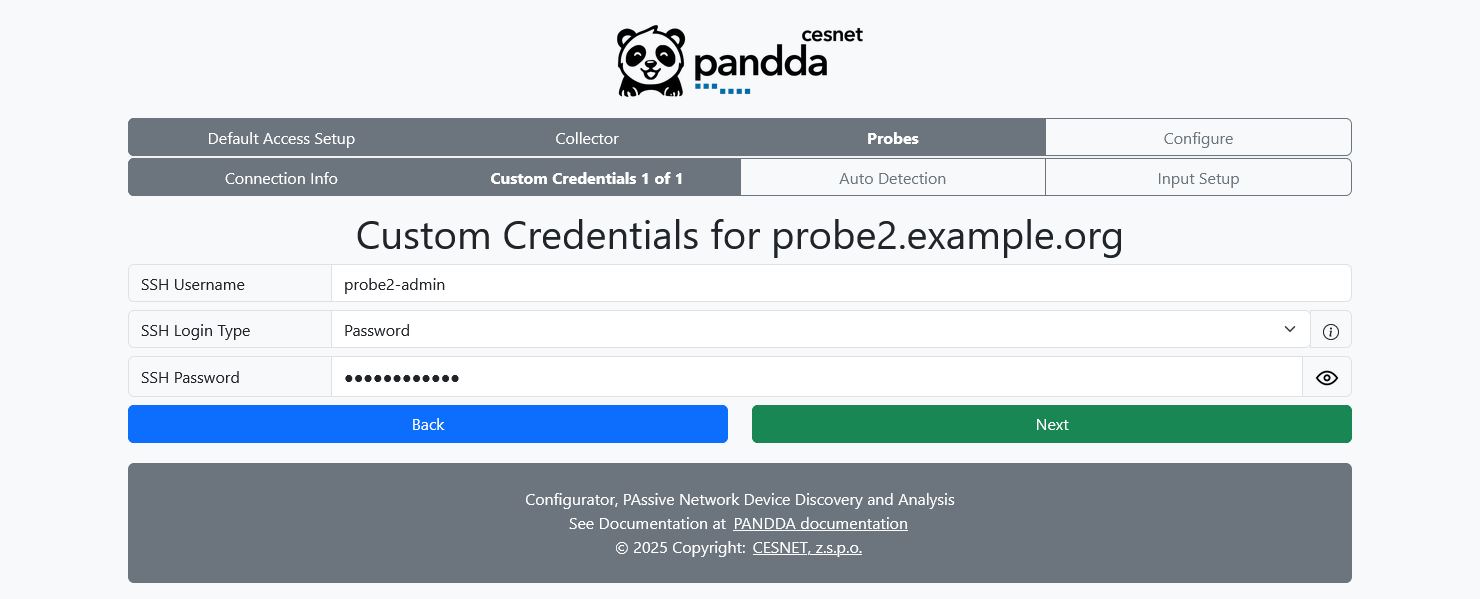
Here you can override SSH credentials for your probes. This page will be present to you for each probe with custom credentials enabled.
Again, you can either provide a password or use the PANDDA-generated key-pair.
For more info about the SSH, please see SSH Academy.
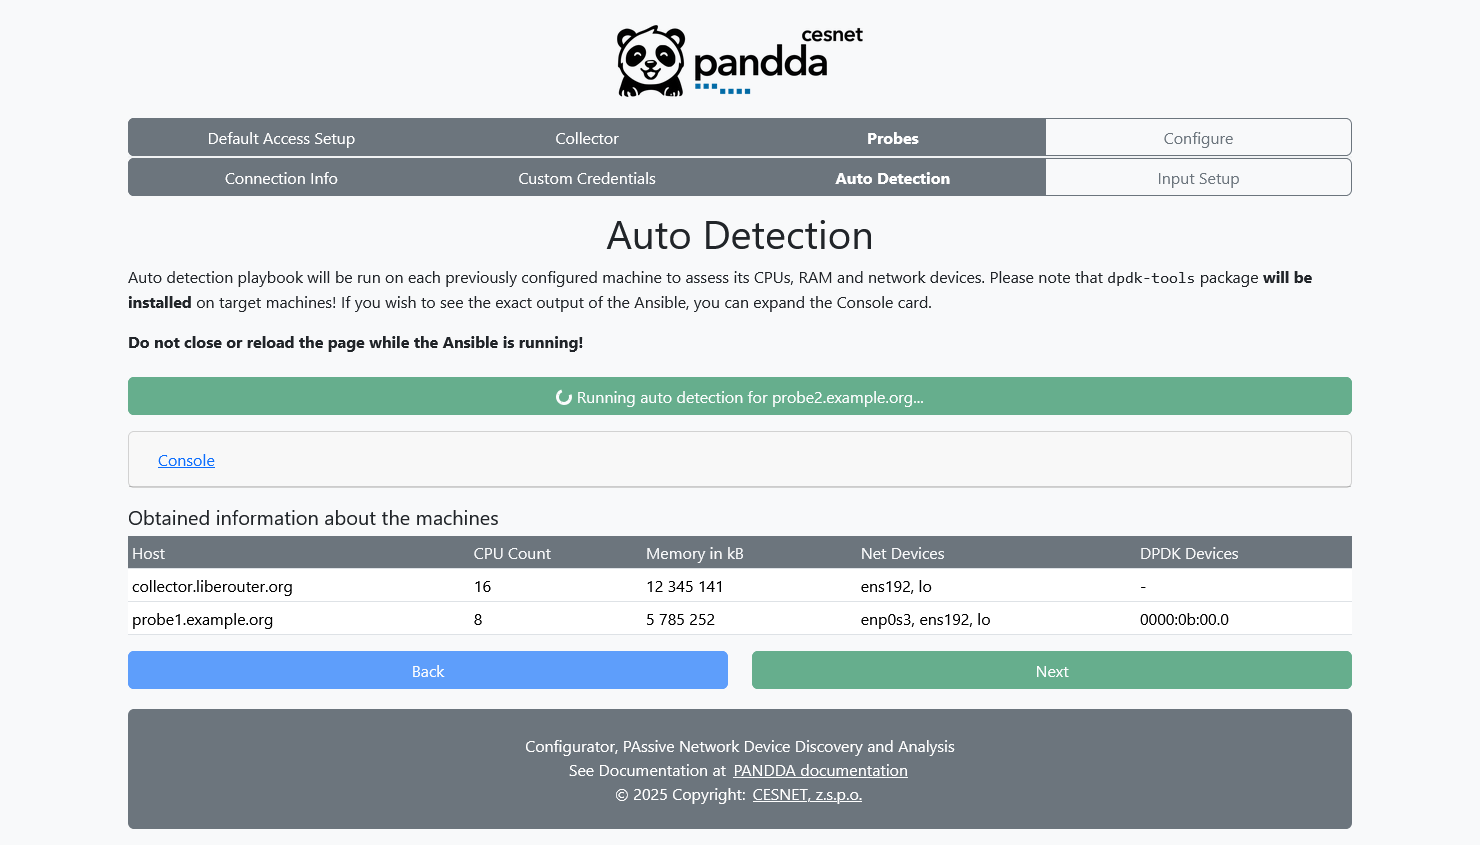
Auto Discovery page runs a prepared Ansible playbook in the backend for each inputted server (all probes and collector). Information about the CPU, network devices and interfaces, and available RAM memory is collected. Configurator uses this information in the next screen (probe setup) to ease the ipfixprobe setup.
Warning 1! The playbook installs dpdk-tools package on the targeted machines, to extract information about the DPDK-supported devices.
Warning 2! Do not close, navigate back or next in the Configurator before the auto detection is completed!
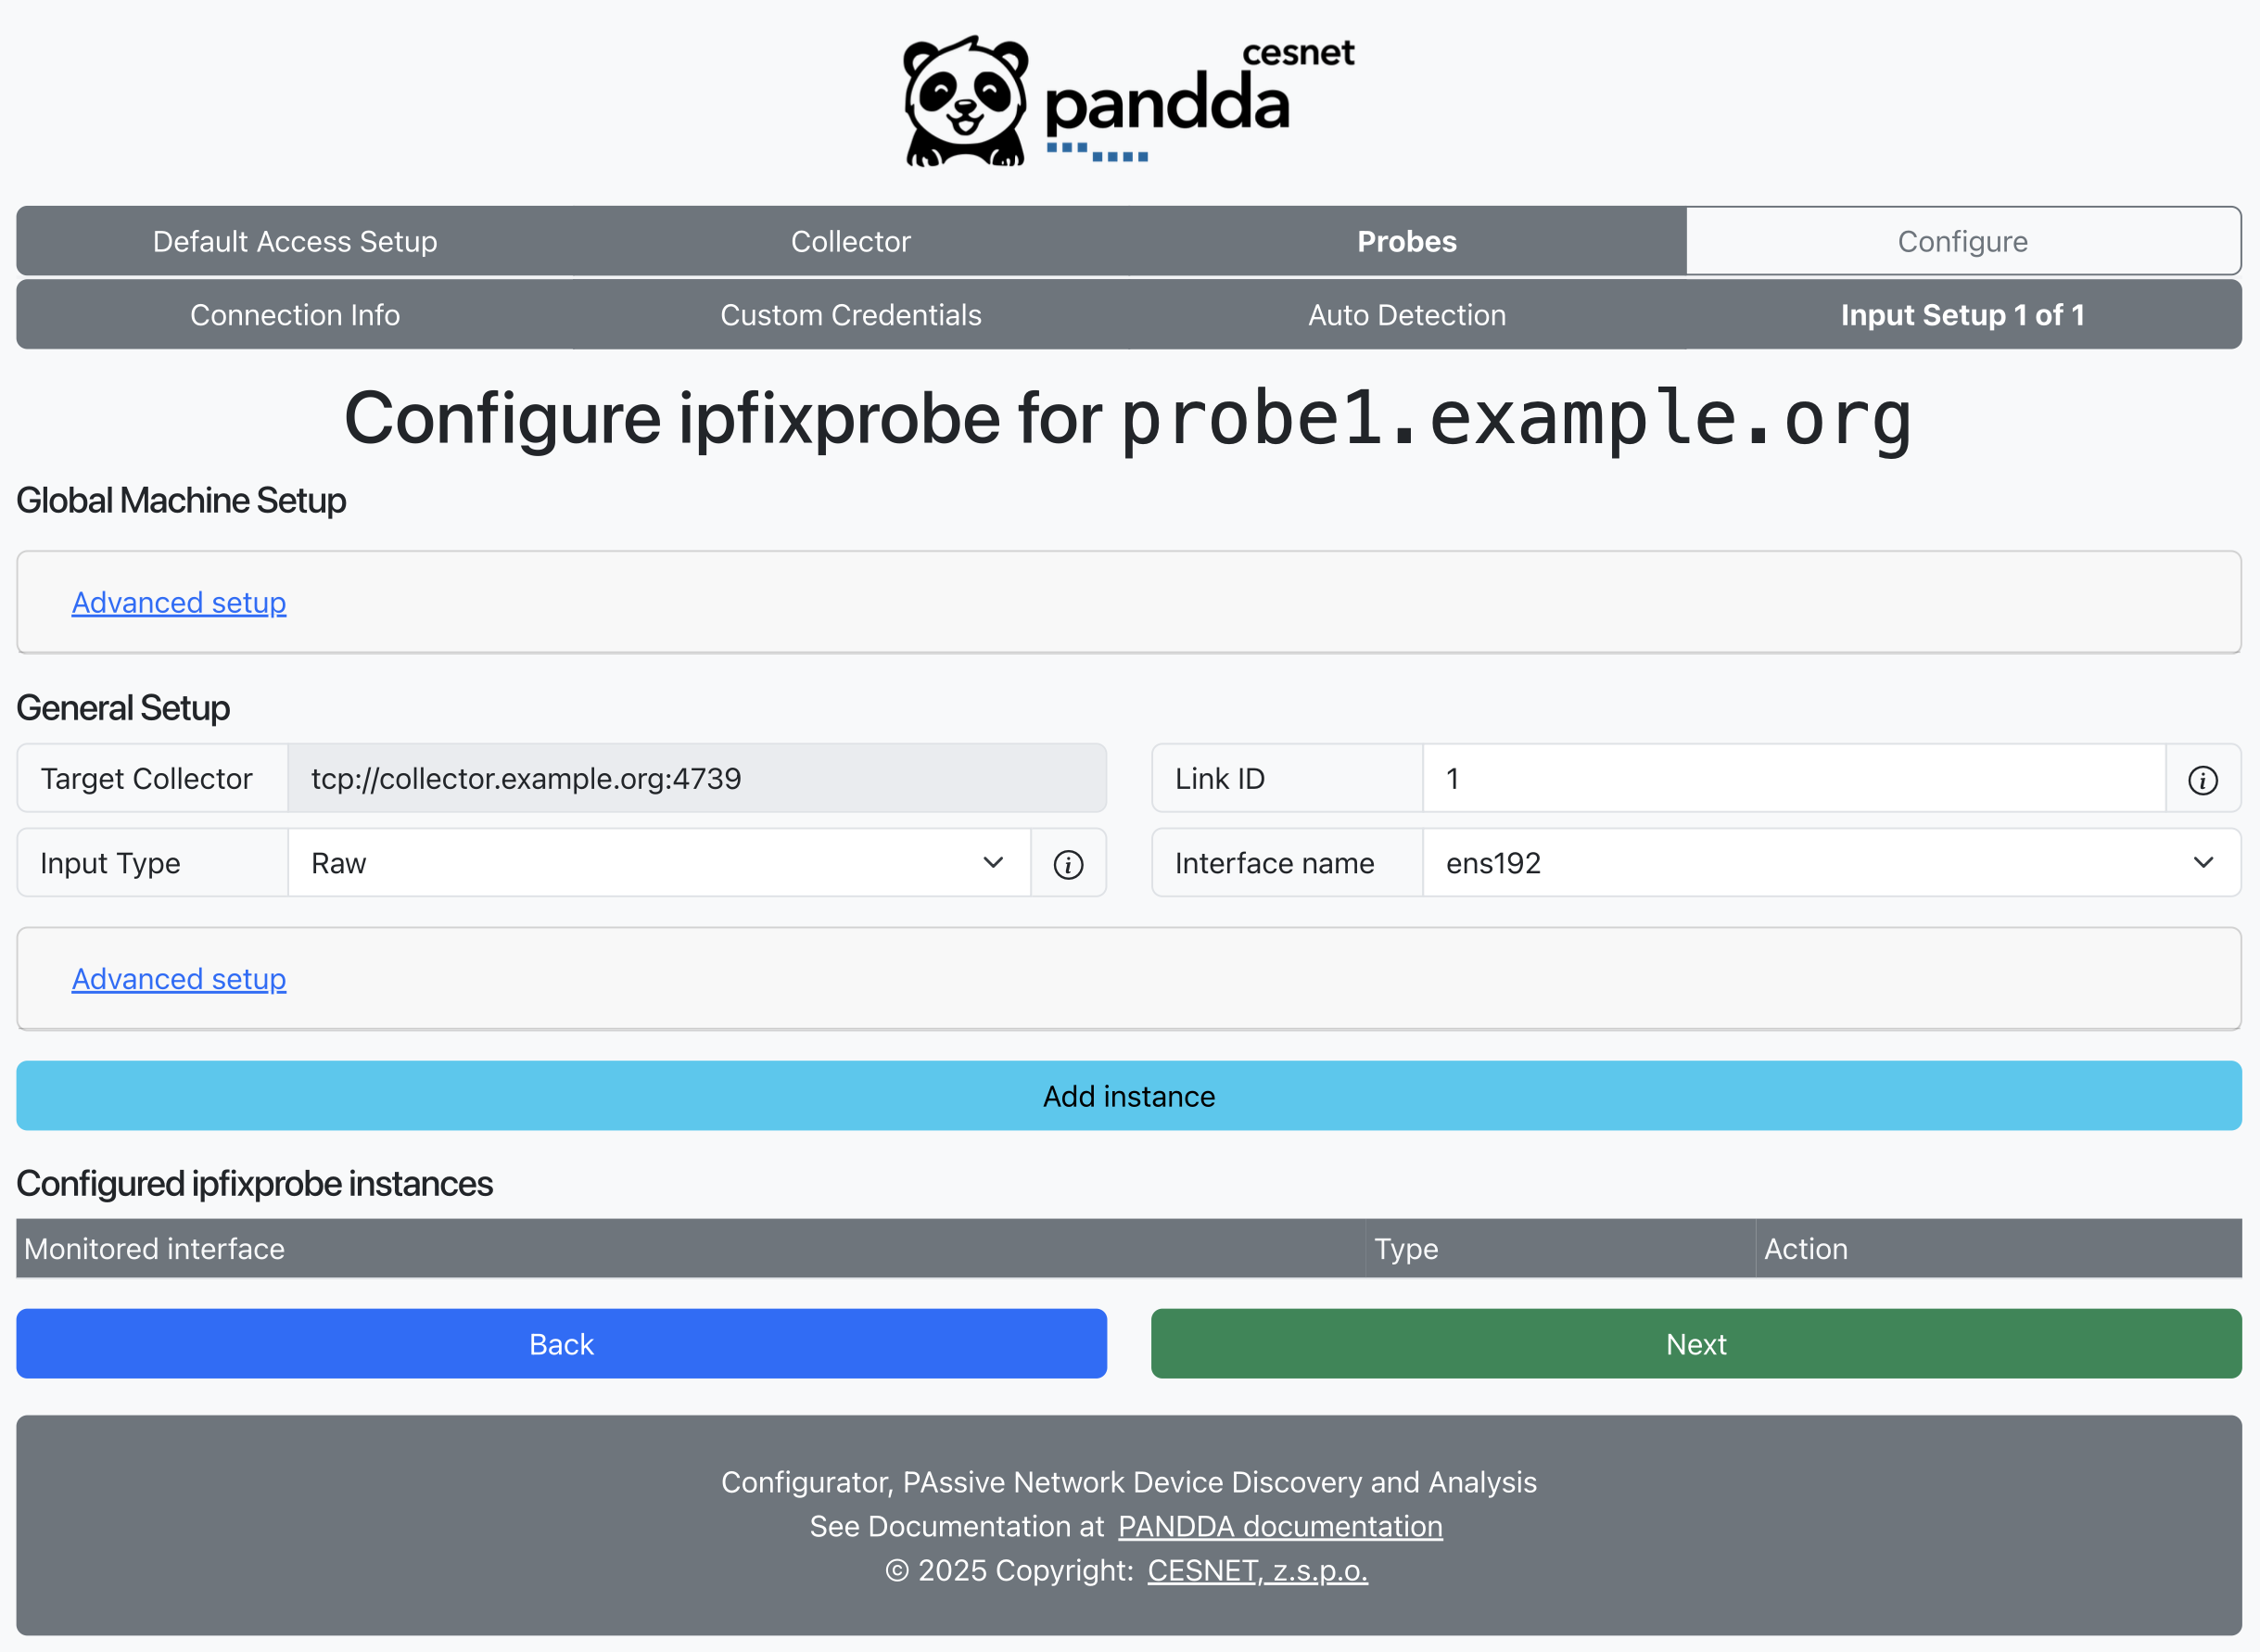
Input setup page is used to setup ipfixprobe and configure which network interfaces will be monitored. You can define multiple ipfixprobe instances for different network devices.
Target Collector is already pre-filled for you and it points to the collector server defined earlier.
Link ID should be unique number throughout the whole PANDDA system. It is used to identify flow data from different ipfixprobe instances.
Then, you have to specify input for the new ipfixprobe instance. Two main types are supported: raw and DPDK. If you choose raw, raw network device from the next input field Interface name will be monitored by ipfixprobe. If you choose DPDK, then ipfixprobe will use DPDK and the DPDK-supported device from the Device field.
For expert users! If you are an expert user, you can configure additional settings described below.
Cache size defines an exponent e which is then used by ipfixprobe to allocate 2 to the power of e of rows in the cache.
Timeouts can be defined in Active timout and Passive timeout fields. For explanation of the timeouts, please refer to the ipfixprobe documentation.
Then, there are input-type-specific settings for the type Raw. You can also specify Blocks (see kernel settings) and Packets (packets are processed in bulks and size of such bulk can be customized via the Packets value).
The input-type-specific settings for DPDK include RX Queues, Burst Size, Mempool Size, and EAL Options.
Finally, you can also set individual ipfixprobe process plugins on or off. Again for ipfixprobe process plugins, please refer to the ipfixprobe documentation.
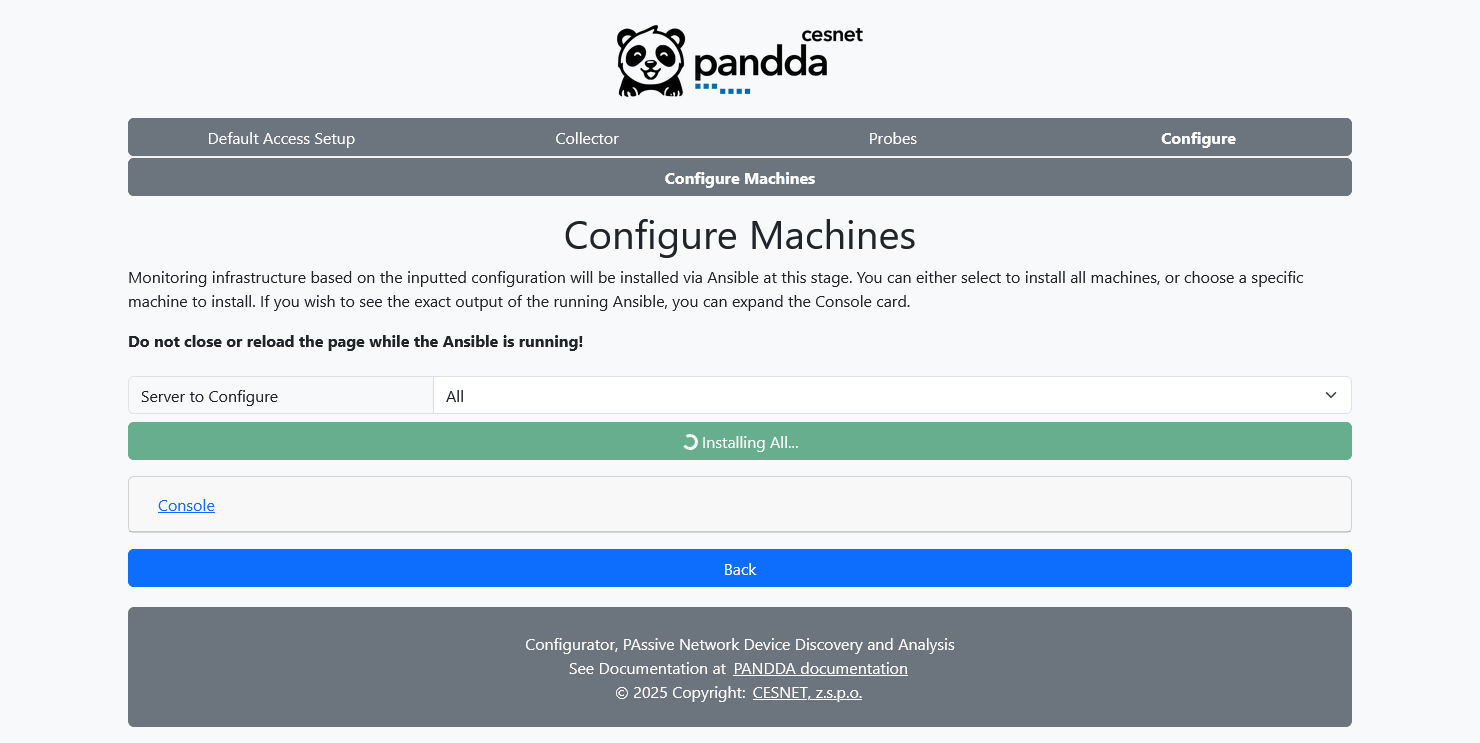
Finally, Configure Machines page is used to run machine provisioning. You can either select a machine which will be provisioned or you can choose All option and provision all of the servers, one at the time.
If you wish to see the progress and Ansible output, open the advanced console viewer by clicking on the Console.
Warning! Do not close, navigate back or next in the Configurator before the provisioning is completed!