After network flows are collected, they are processed using NEMEA modules, which extracts valuable insights for security analysts and network administrators. Instead of just recording raw communication, NEMEA filters relevant data, enriches it with domain knowledge, and transforms it into actionable insights about network devices.
This processed information is stored in ADiCT (Asset Discovery, Classification, and Tagging), a system that maintains long-term profiles of detected devices. ADiCT runs on the open DP³ platform and supports various modules for enhanced network visibility.
- Tracks communication volume of devices.
- Counts network flows, packets, and bytes in 10-minute intervals.
- Labels activity levels (e.g., idle, medium, high) for easy monitoring.
- Identifies open ports on network devices by analyzing traffic.
- Helps administrators detect running services and potential vulnerabilities.
- Data is periodically sent to ADiCT for tracking.
- Analyzes service banners (e.g., SSH, SMTP) to identify:
- Device types
- Operating systems & versions
- Running services
- Helps detect outdated or vulnerable software, improving security.
- Resolves IP addresses into domain names for better device identification.
- Identifies misconfigured DNS resolvers that could be exploited for cyberattacks.
- Warns administrators of potential security risks (e.g., DDoS amplification).
All collected data is stored in ADiCT, allowing users to track historical device activity. The system is designed for future expansion, supporting additional modules to further enhance network security and device monitoring.
The PANDDA infrastructure includes a user interface for the ADiCT system. The PANDDA GUI displays the stored data and allows filtering and querying. For security reasons, access to the interface is only allowed to authorized users based on a login name and password set by the installation tool. While other components of the PANDDA infrastructure are based on pre-existing software, the GUI was developed specifically for the PANDDA project.
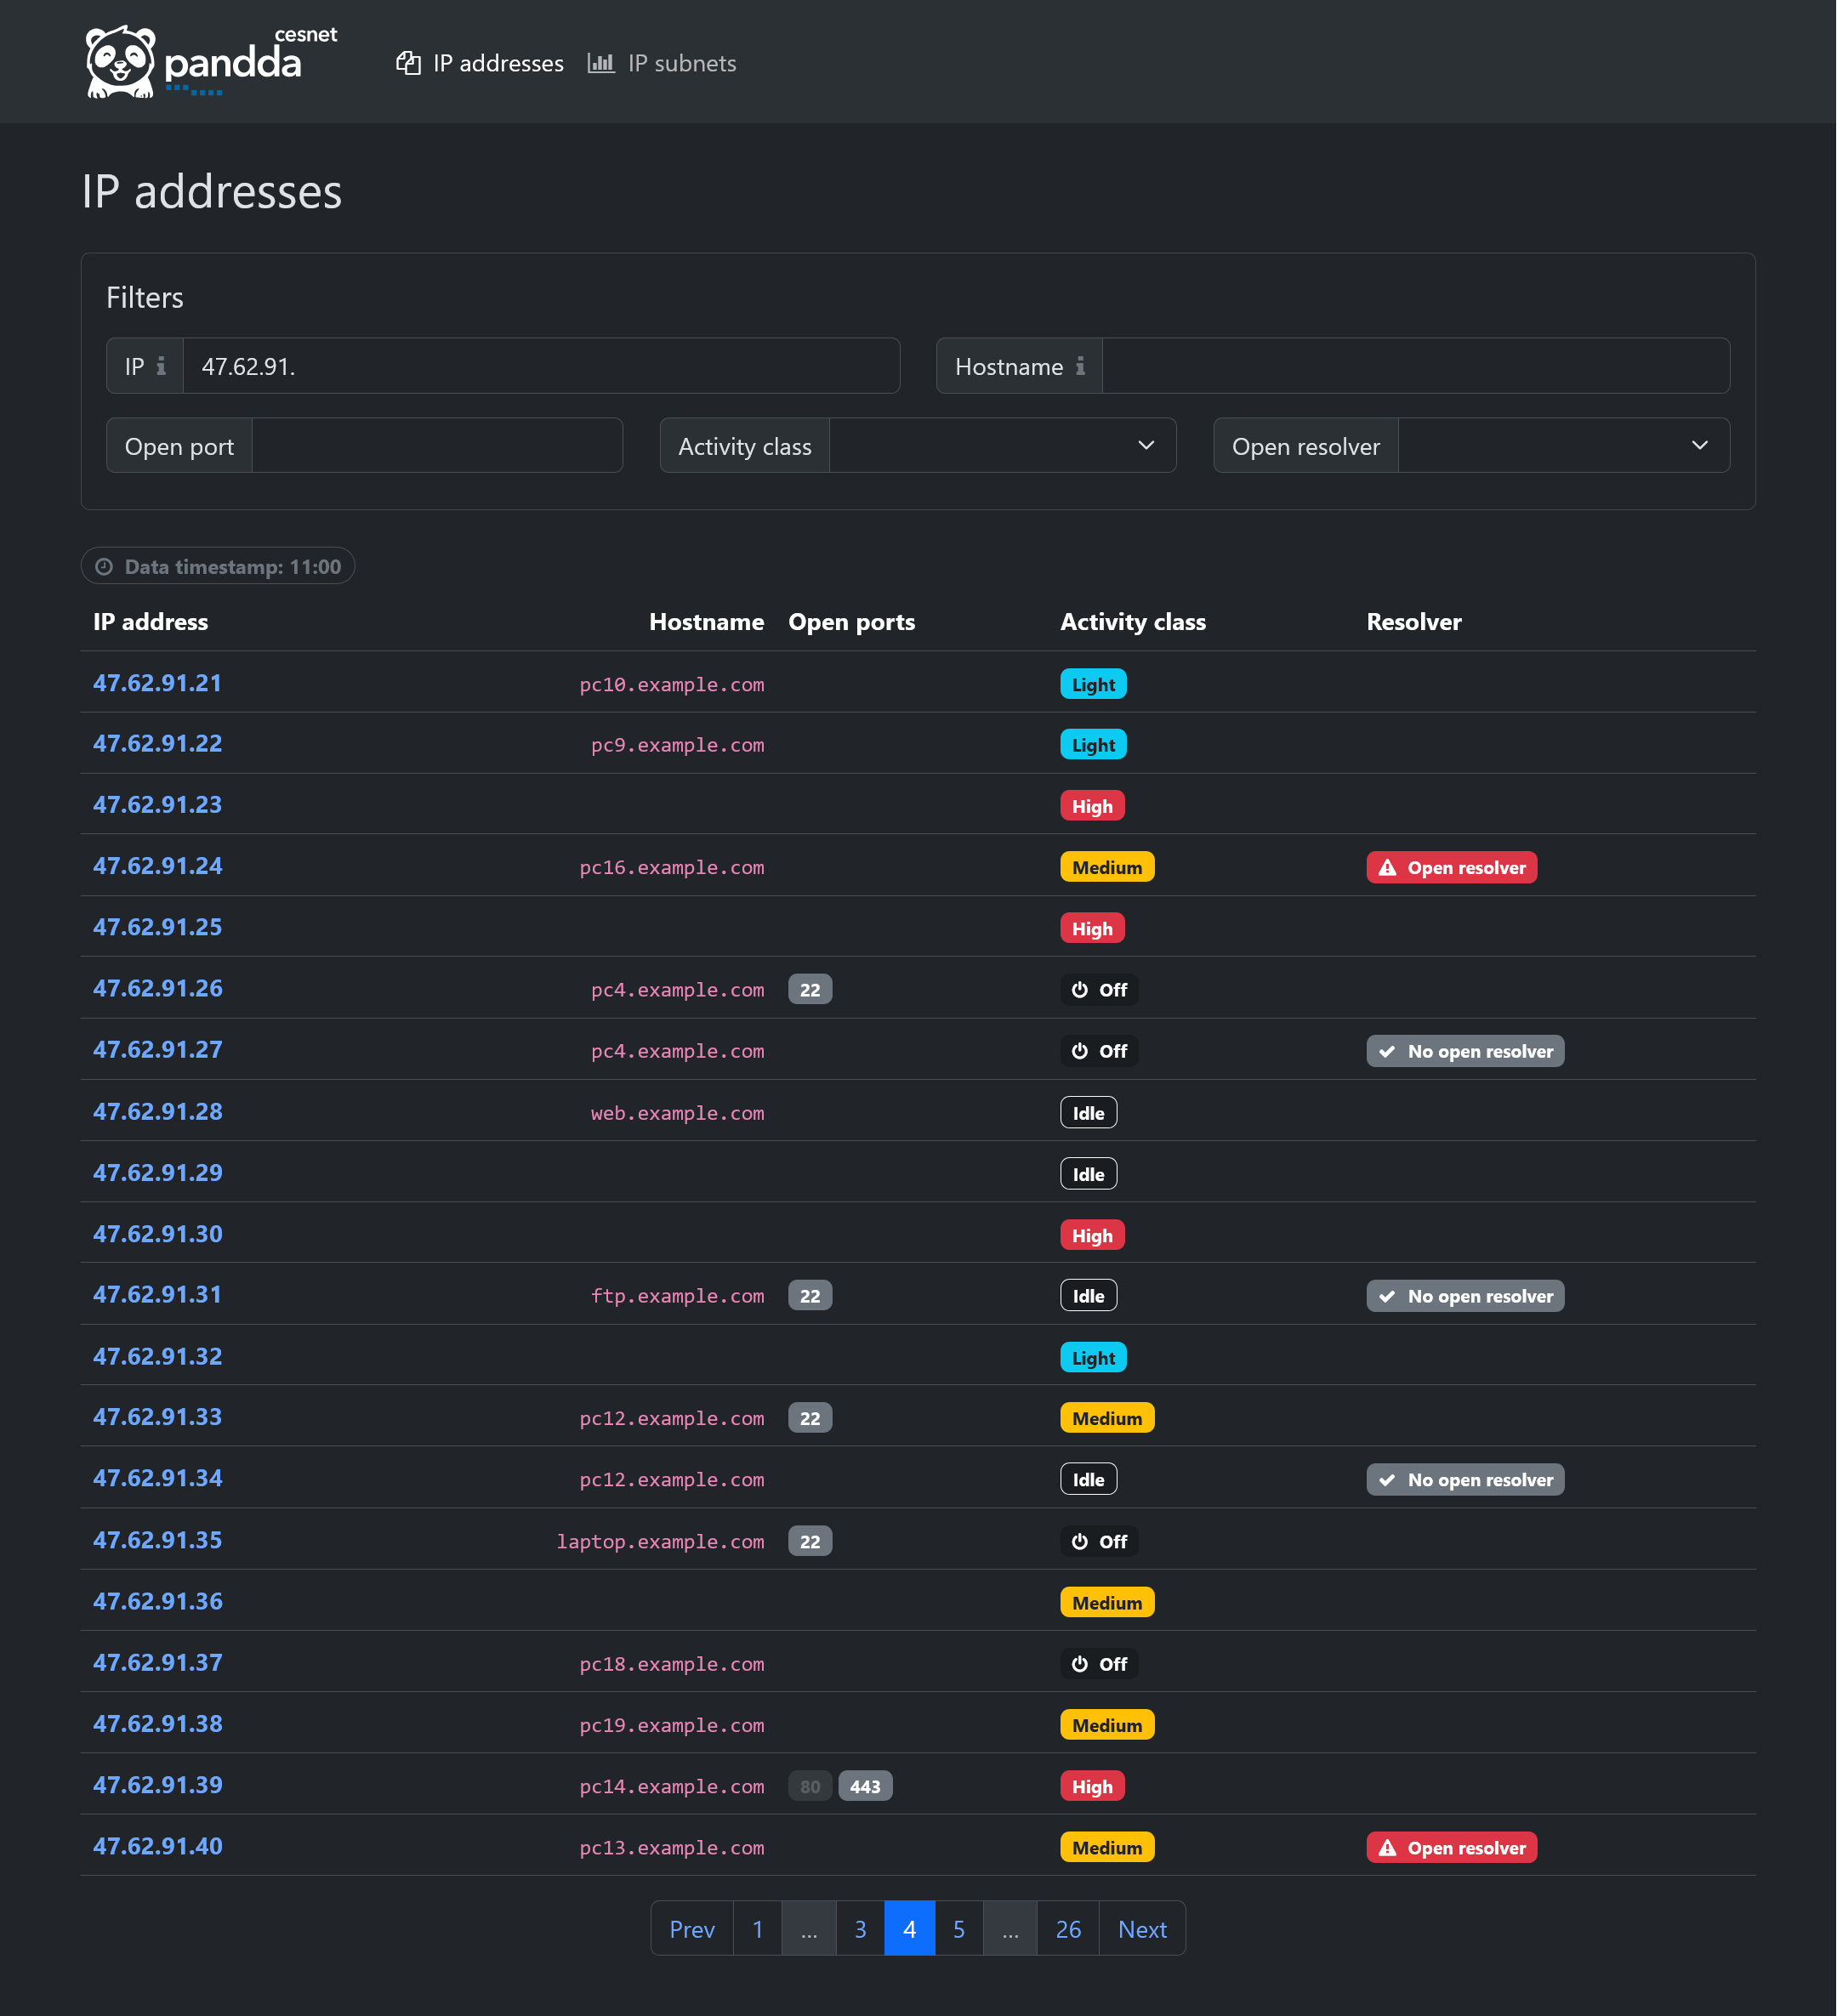
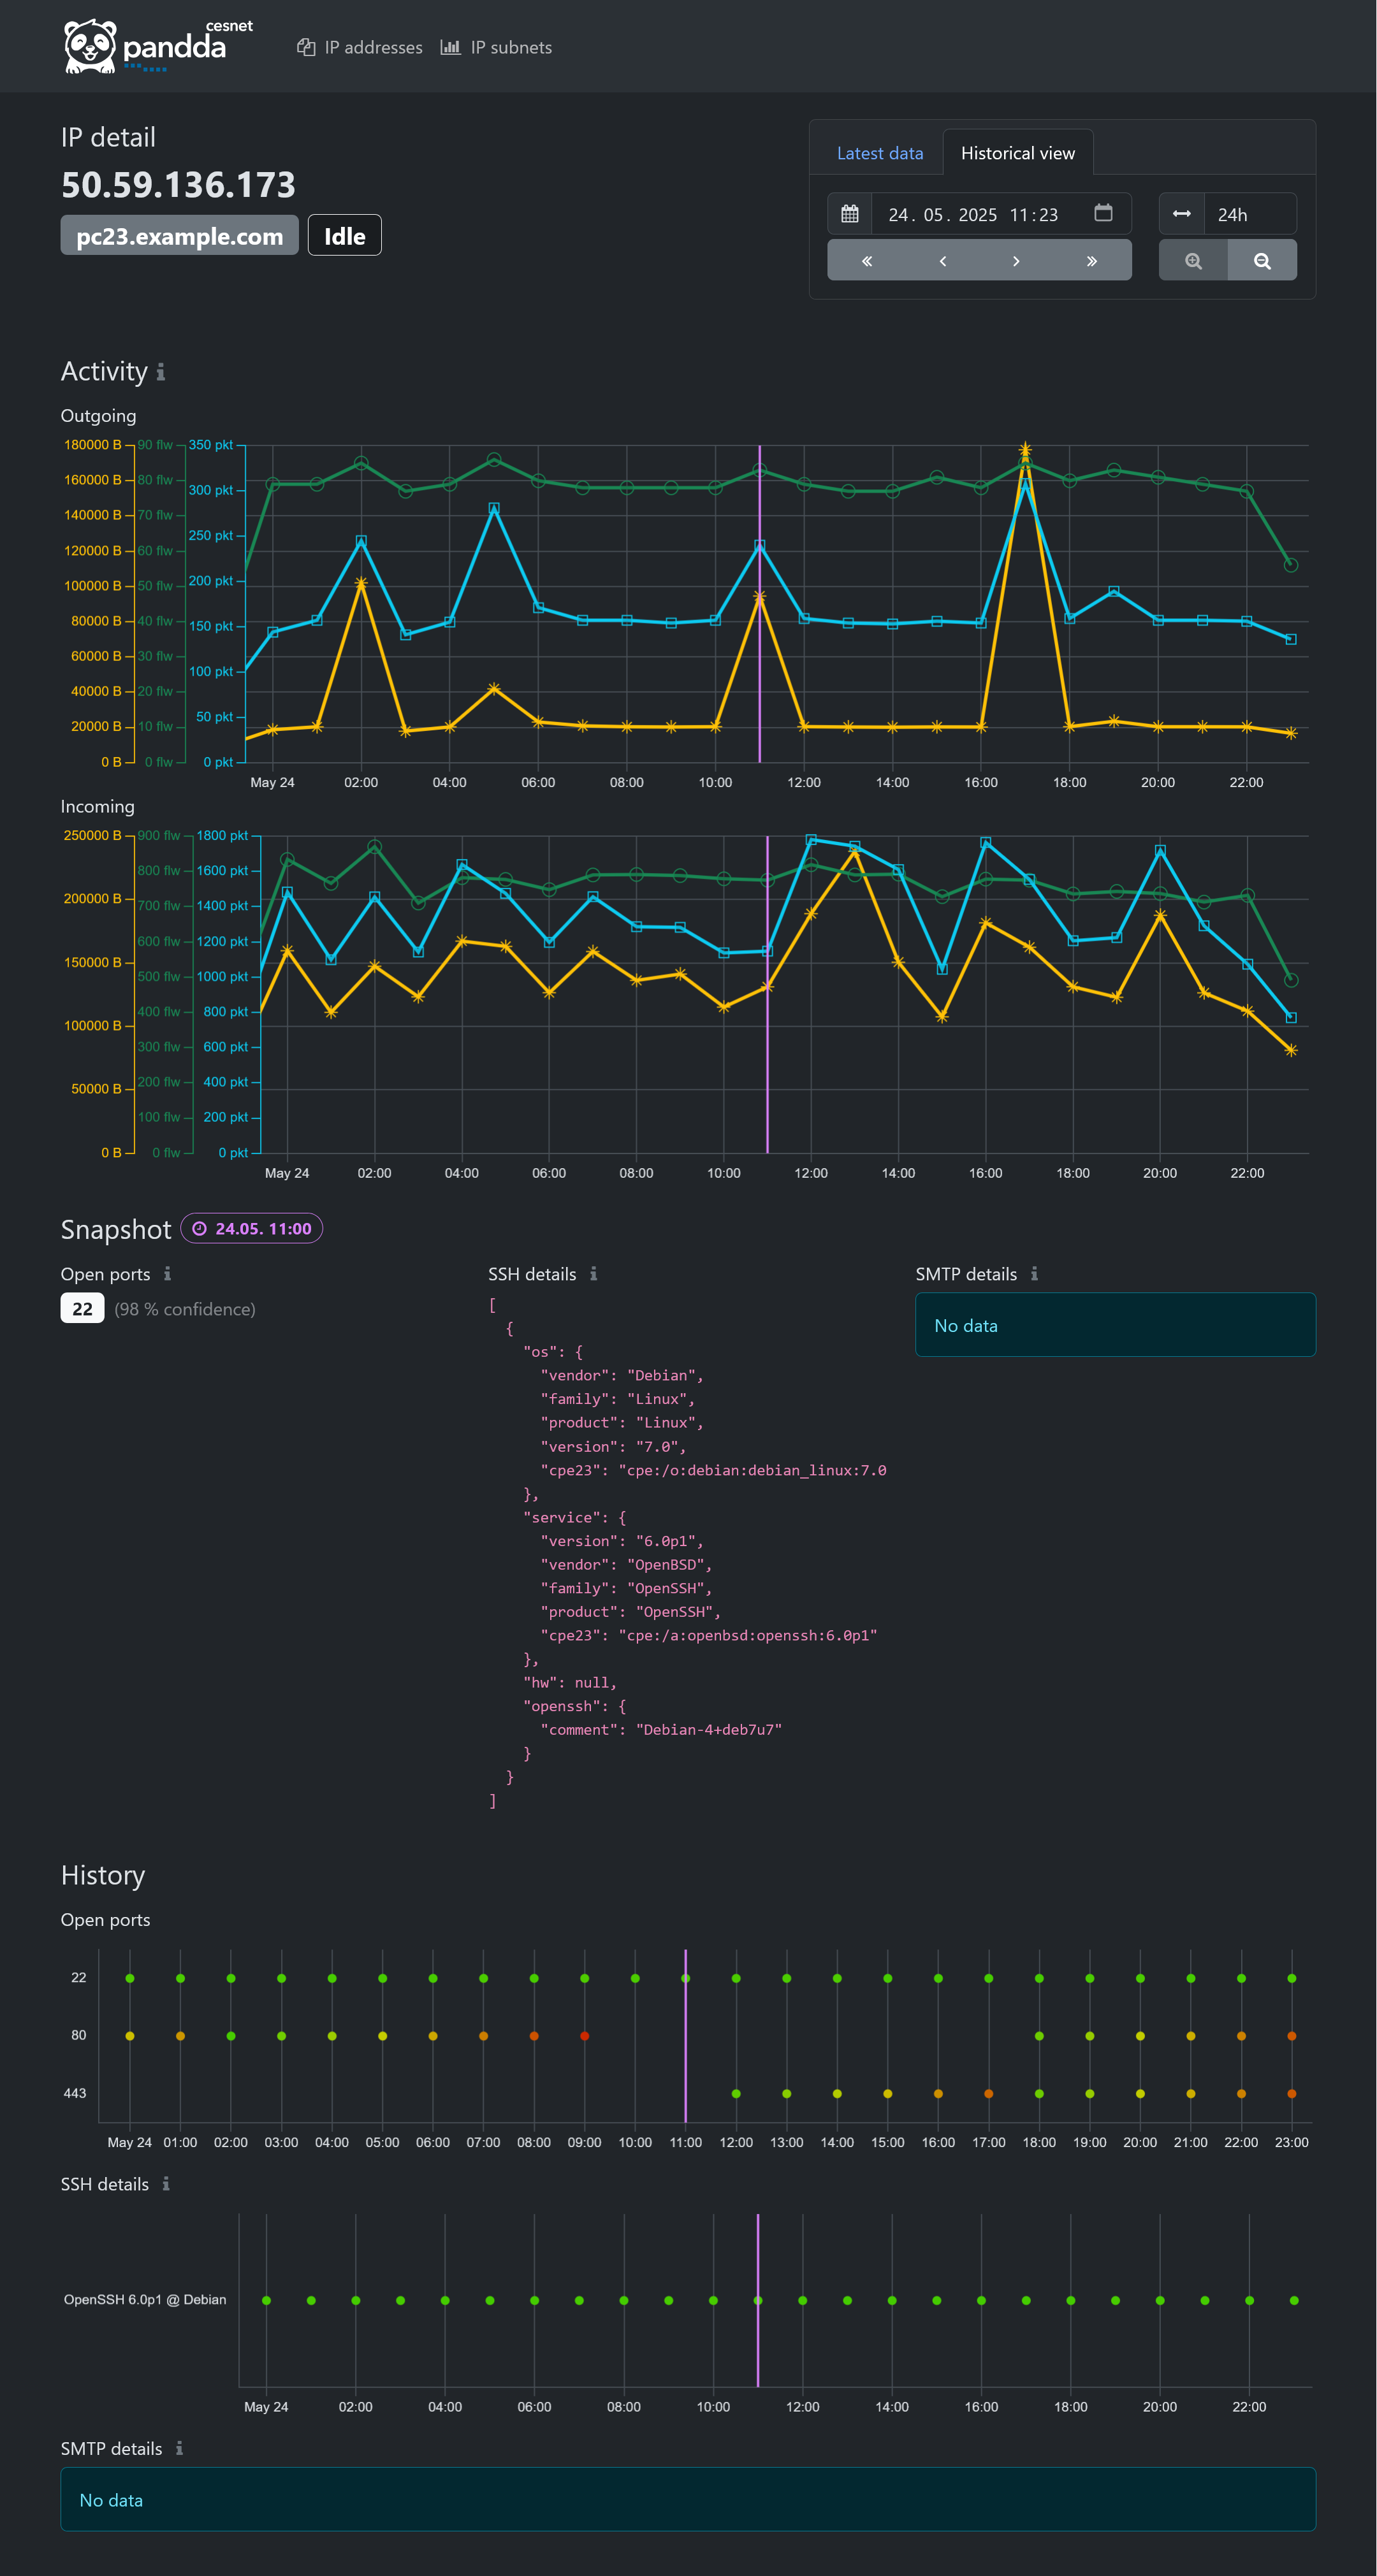
The main page of the user interface is an overview of IP addresses (picture below) consisting of filters and a paginated table with current data. The table contains the IP address, device name, list of open ports, activity class, and an open DNS resolver indicator. All of this data can be filtered.
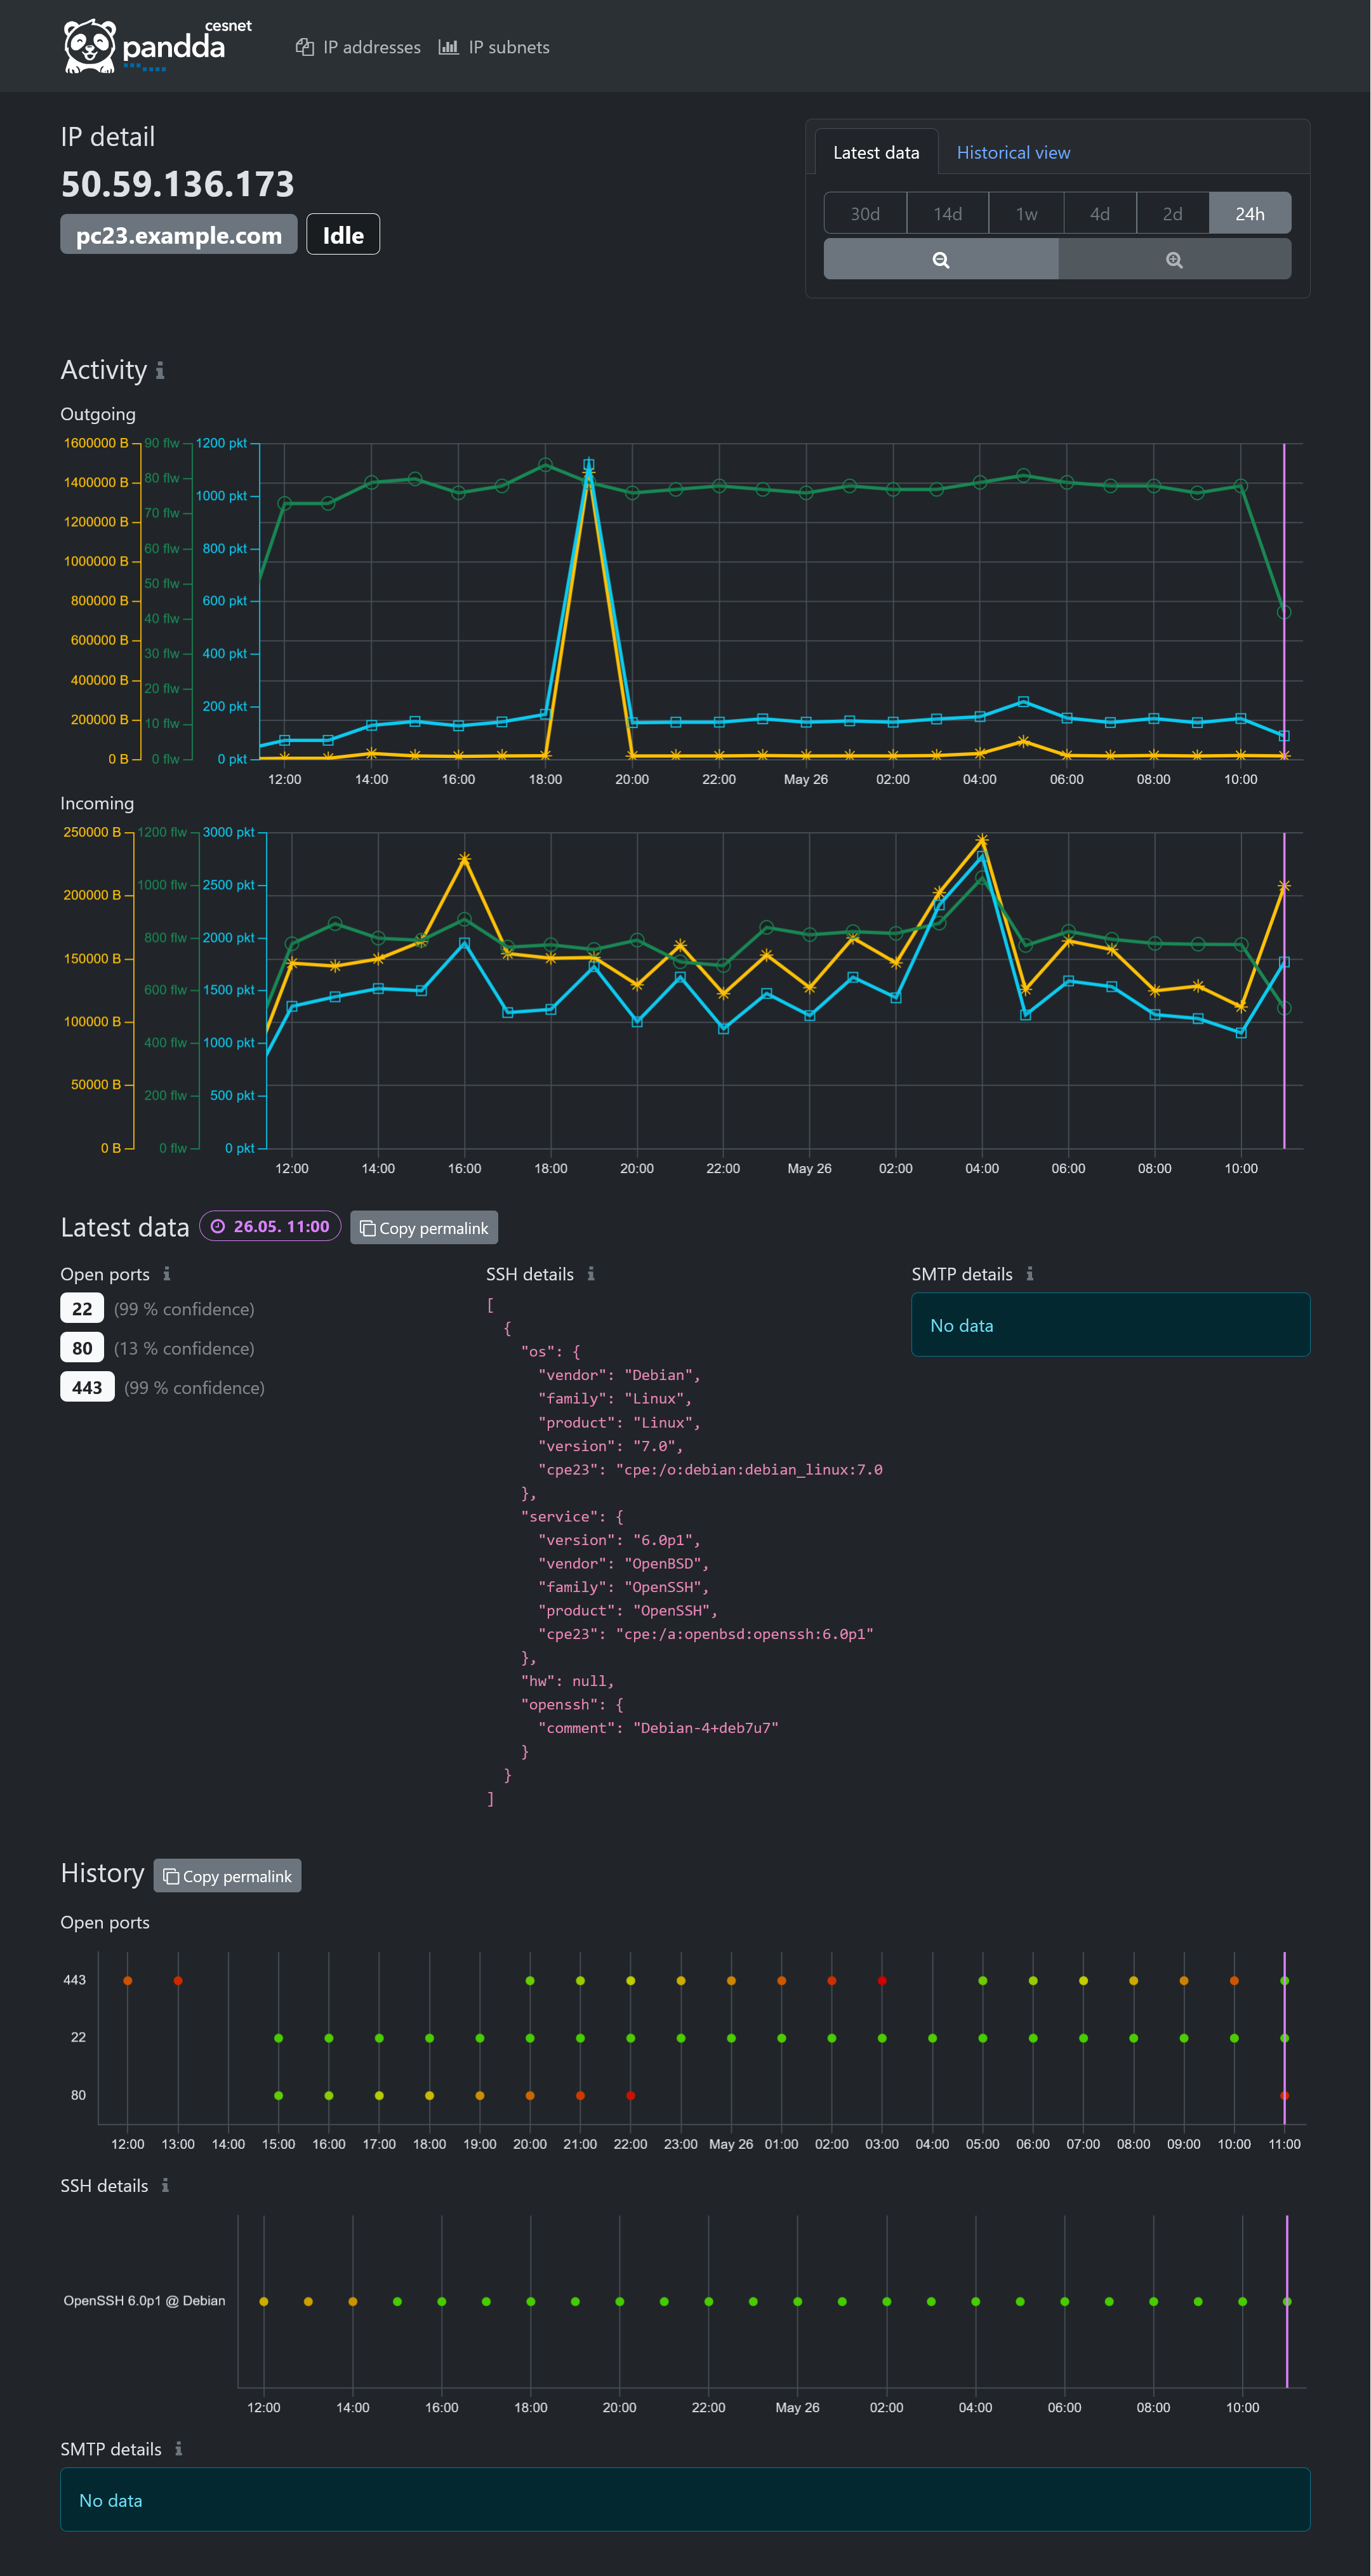
Clicking on any IP address in the table displays its details. The IP address details (picture below) contain current (latest) data or data history. The page's header has a selector for selecting a time and display mode. Latest data mode displays data points from the latest 24 hours or more (as selected). Historical view allows the user to inspect data history at an arbitrary time point using a window of selected size (24 hours or more).
The displayed data contains a list of open ports, including the level of trust (confidence), banners of SSH and SMTP services from the Recog module, and a graph of IP address activity - the number of bytes transferred, packets, and the number of flows on the network.
All charts contain a violet line at selected time point. Data at that time point are then showcased in the Snapshot section.
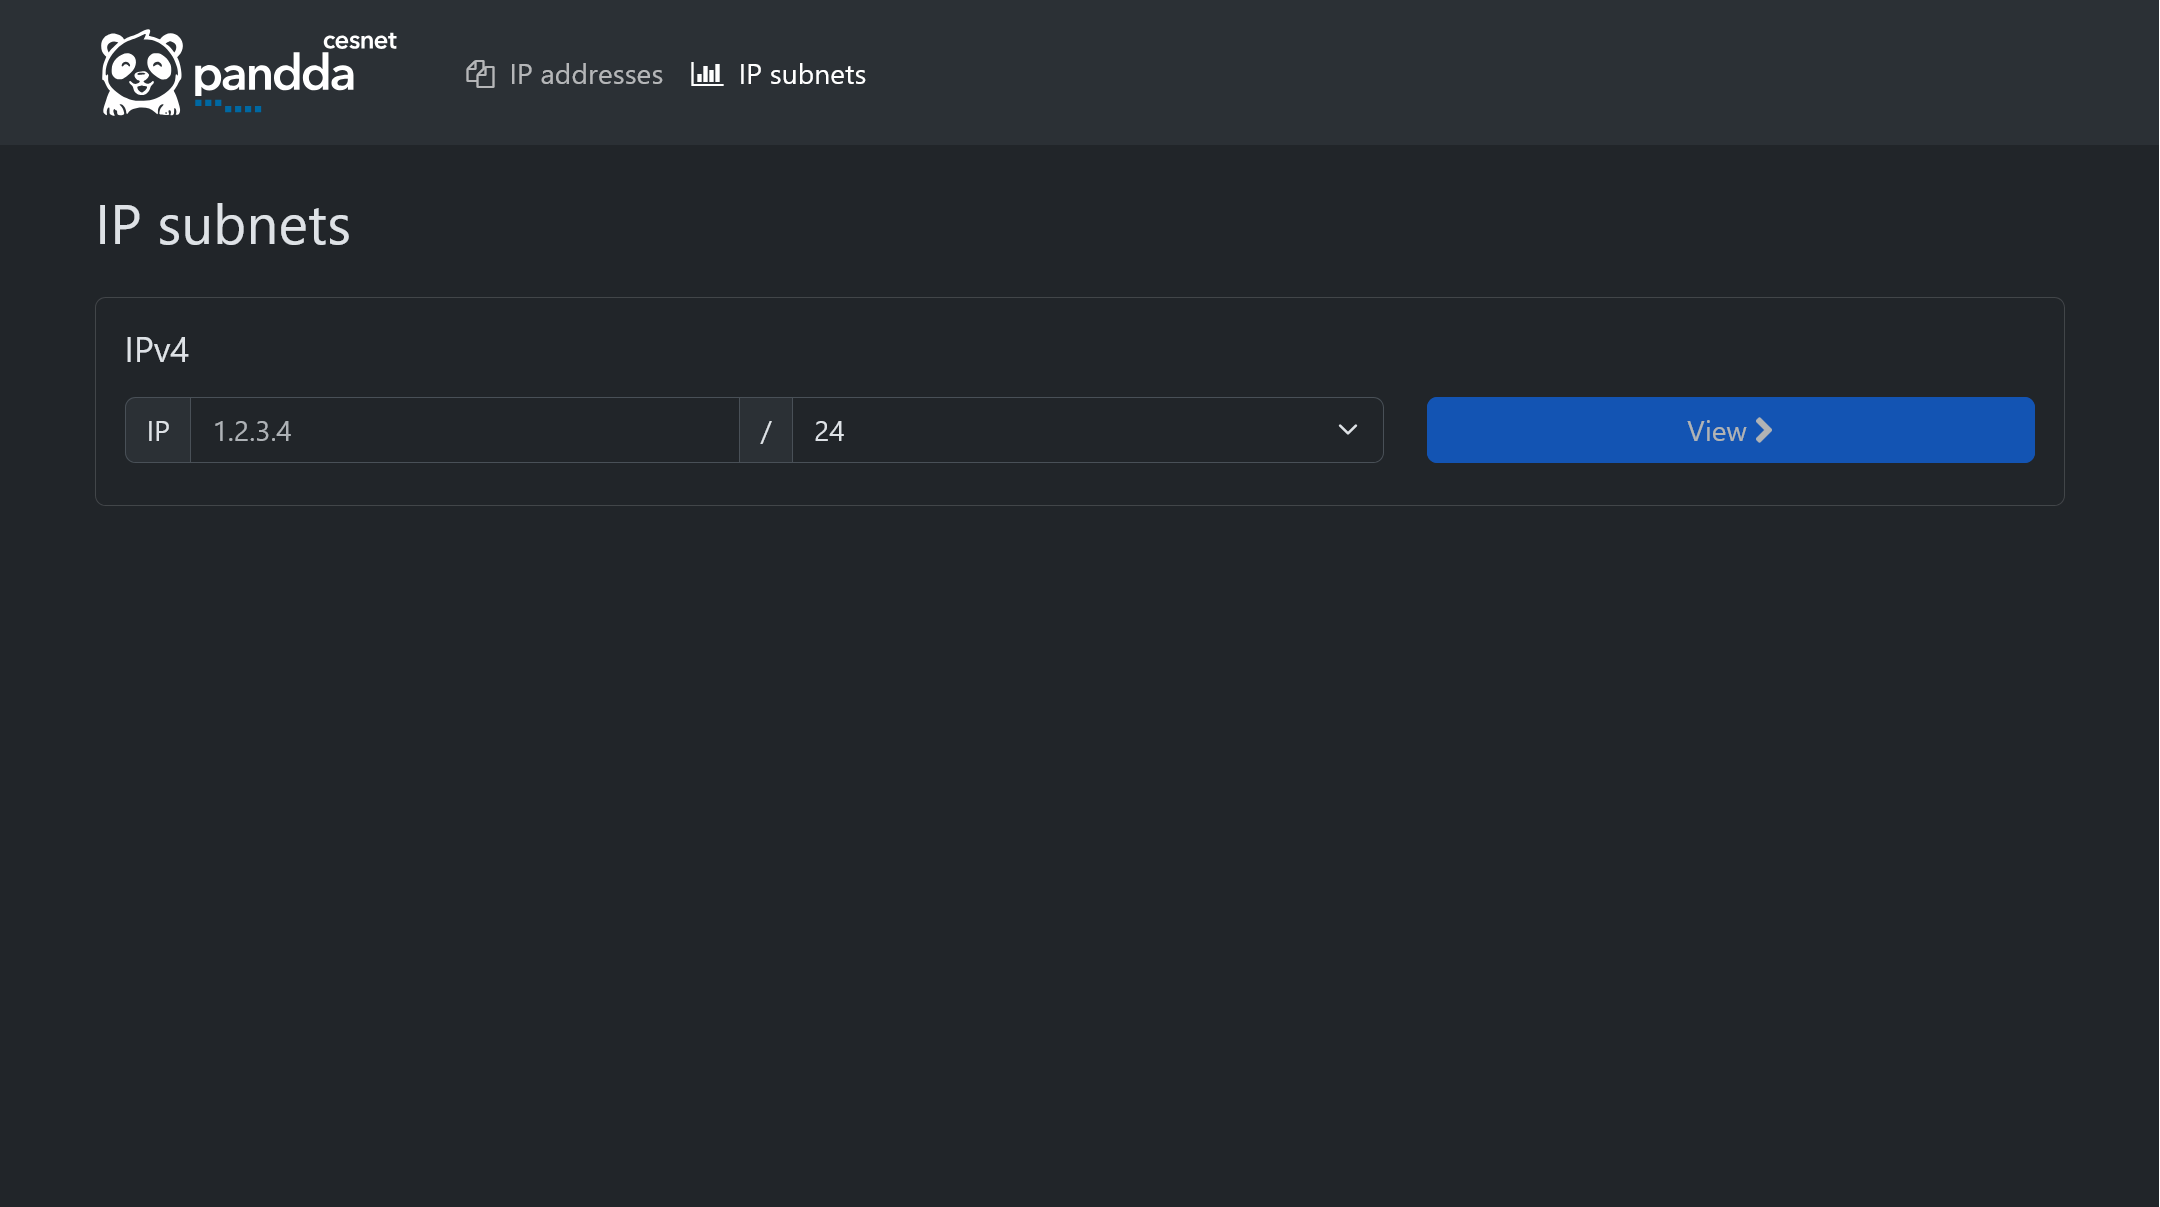
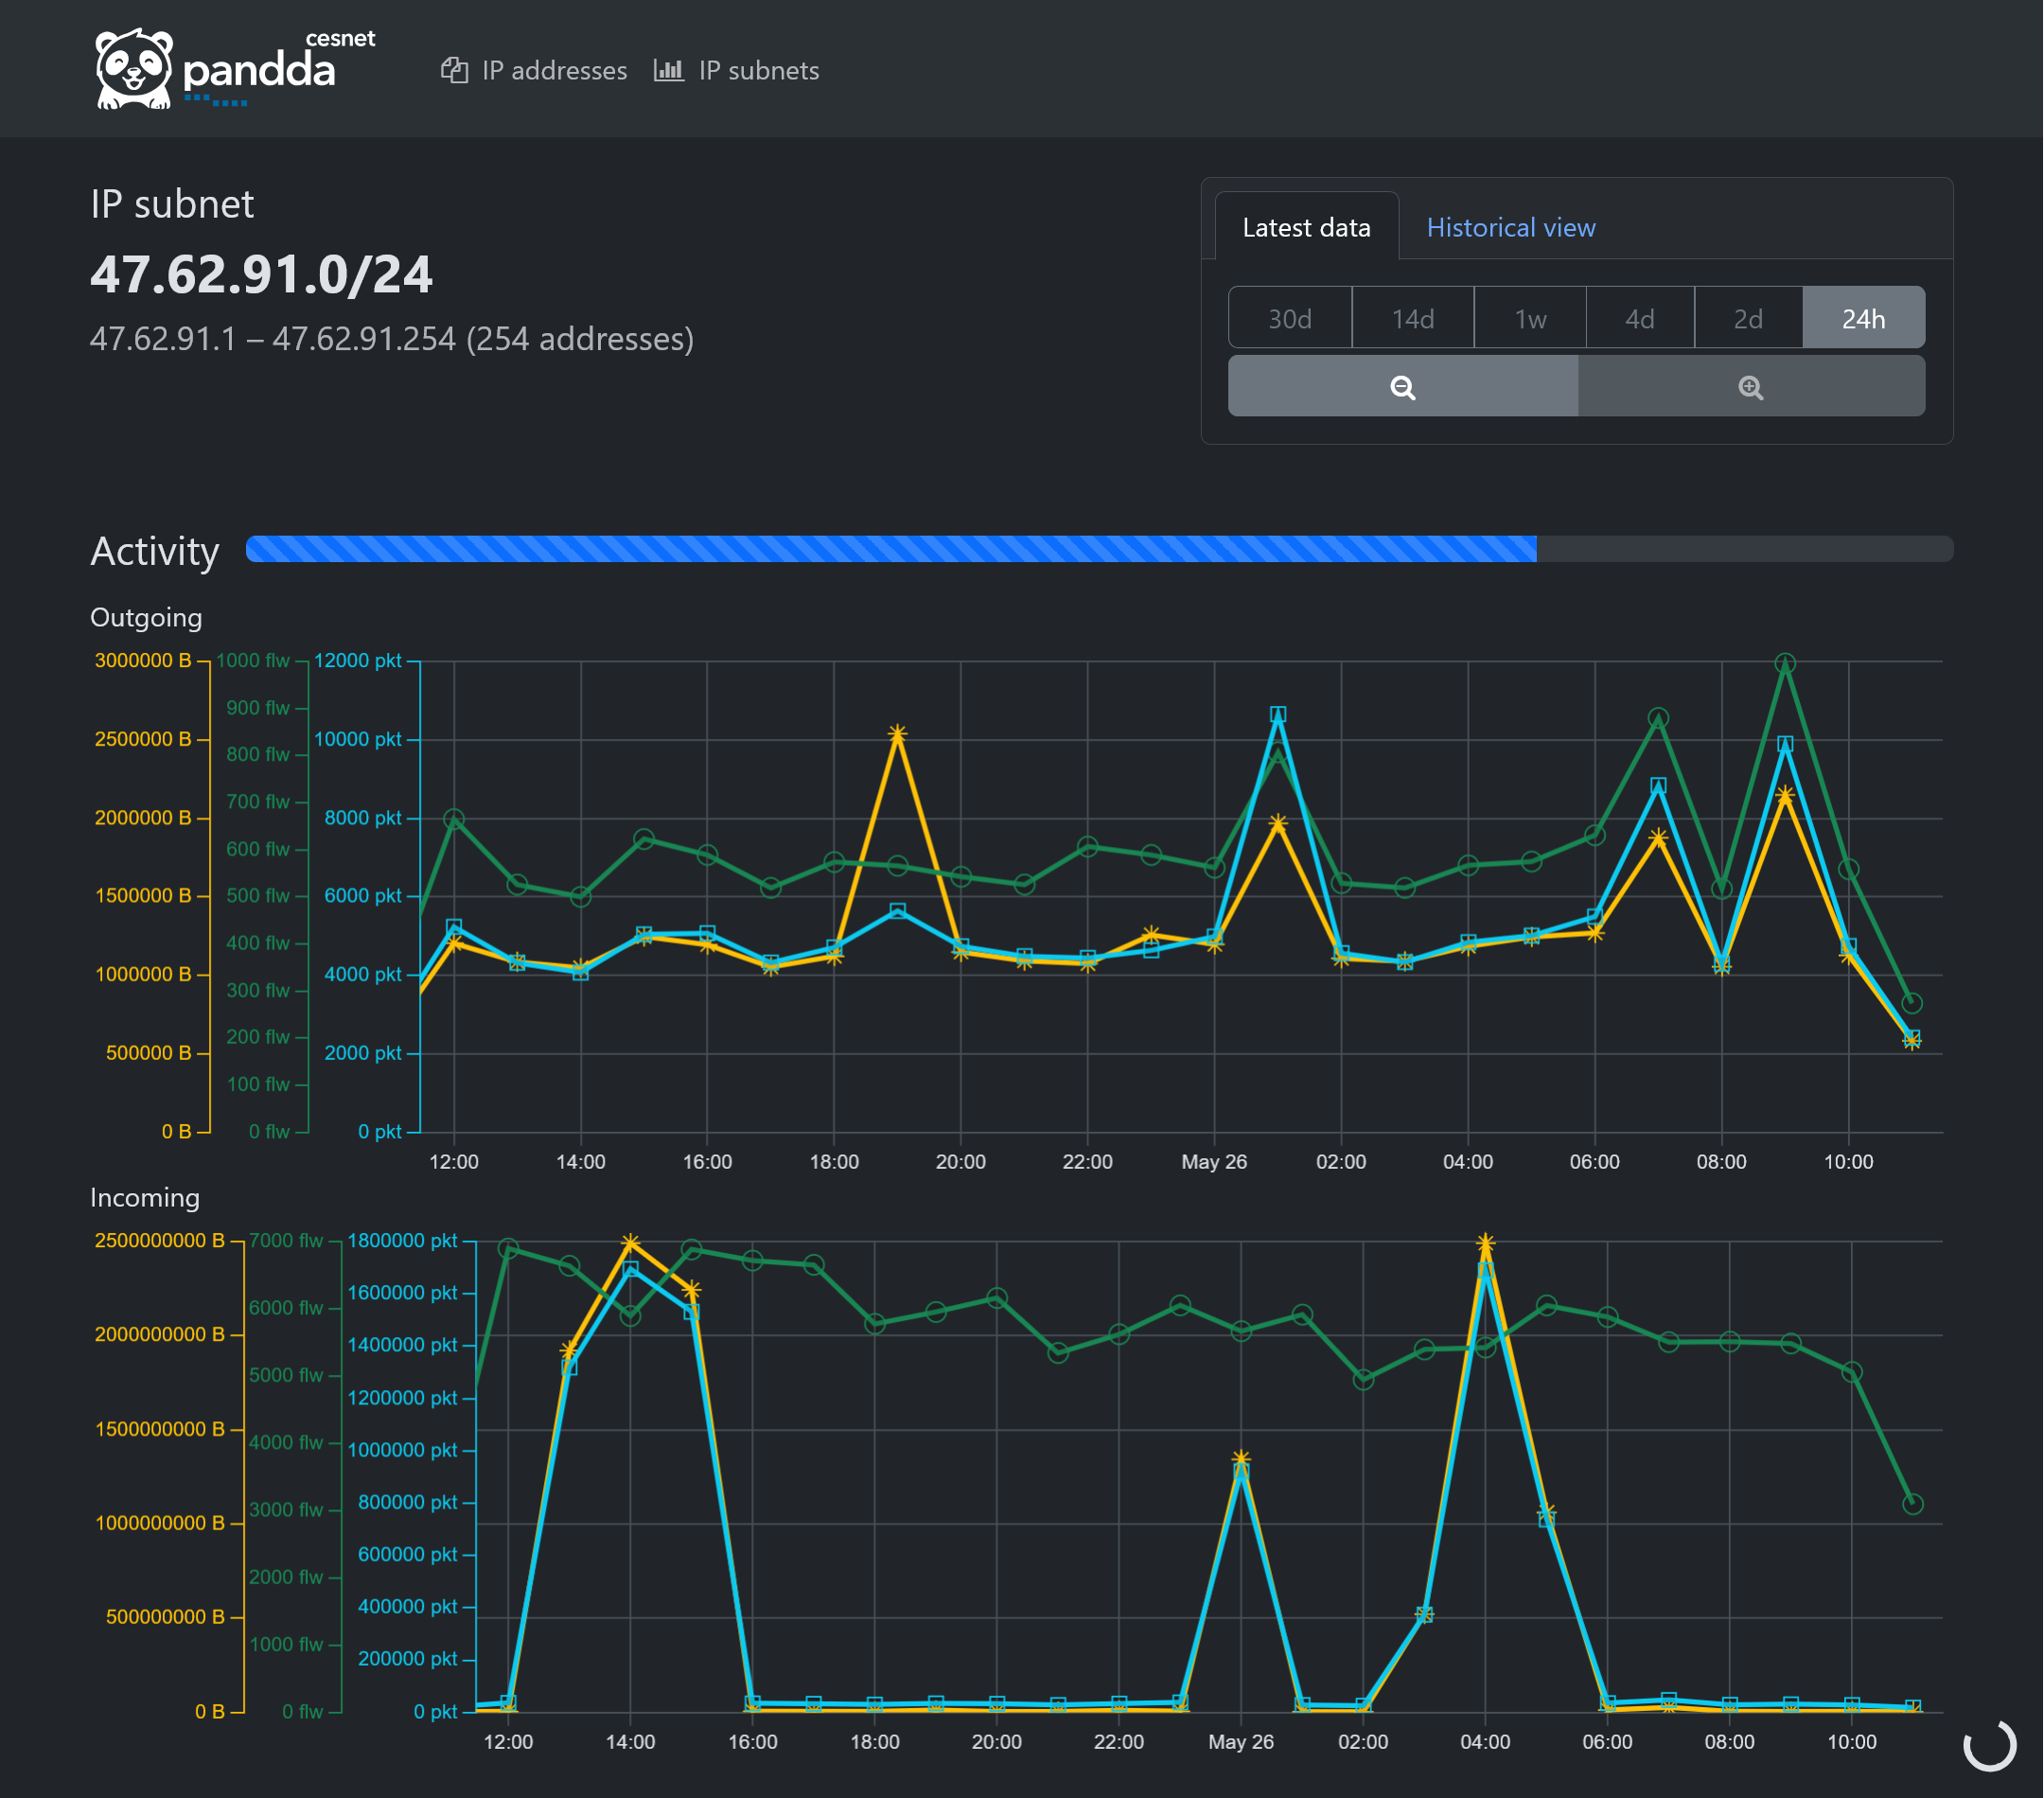
For convenience, there's also a simple page for IP subnets. It's possible to select arbitrary network subnet and query activity of associated addresses, as shown in the screenshots below. The page contains an aggregated IP activity chart so that PANDDA GUI can act as a basic replacement for a flow monitoring software.
Be aware that addresses are queried one by one (even though with some parallelism), so data gathering for large subnets may take a considerable amount of time.